| |
|
Entry Date
|
Nick Name
|
Location
|
|
Monday, June 15, 2020
|

|
Matt D.
|
Connecticut
|
 |
Entry 142 of 190 |
 |
|
|
|
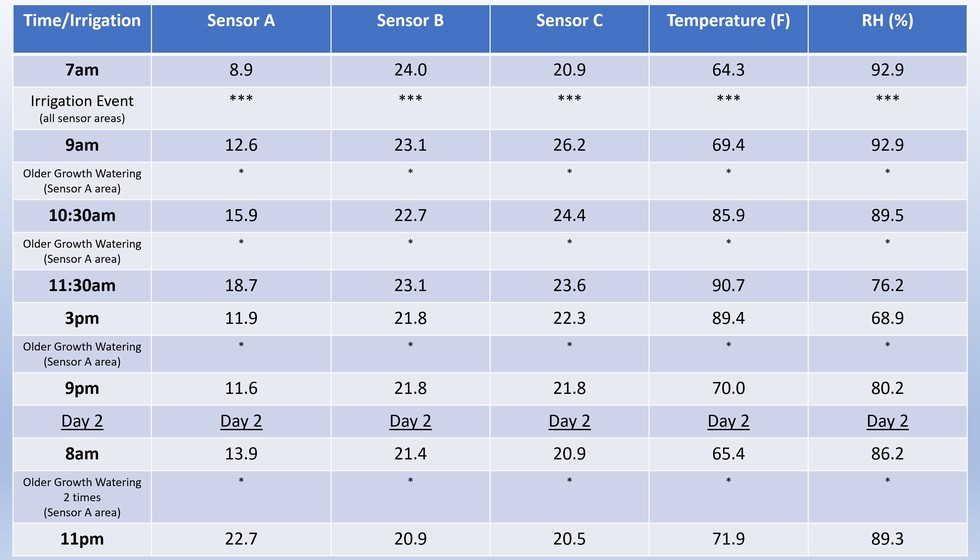
Data Table for Indoor Plant
Again, use this as a relative guide but it does help in providing some information over two days.
Main goal was to see how Sensor A (old plant material) responded to additional irrigation events.
General Summary Points�
-Sensor A reads consistently lower than Sensor B or C
-Sensor A target values for this given situation is 12%-14%
-Temperature seems to quickly spike from 9am-10:30am on sunny days however, the cooling fan system seems to be working well as the temperatures did not go much over 90F.
-During the heat of the day the relative humidity is the lowest (~3pm) despite running mister/sprinkler system.
|
|
|