| |
|
Click on a thumbnail picture below to see the full size version.
|
2 Entries.
|
|
Saturday, October 28
|
View Page
|
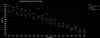 |
Here is the graph for historical top pumpkin and top ten pumpkins from 2005-2023. Despite setting a new world record (congrats Travis), the 2023 data for both top pumpkin and top ten giants remain below the 18 year trendline that has been established. While the diagonal lines through both data sets are highly representative of the future trajectory for the hobby (as indicated by the R-squared values >0.9), the line/curve is showing some signs of "flattening". For math nerds, the slope of this linear equation has been on a year-over-year decline since its high water mark in 2016, at a rate of almost -3%/year, where M= 94, 89, 88, 85, 83, 82, 79, 77 for each year since 2016-2023. This declining slope continues to push out the predicted 3000lb achievement. One can use this linear equation to calculate predicted top weight values for each year going forward. If future weights ride this trendline, data suggest the following top weights: 2024= 2846lbs, 2025=2923lbs, 2026=3000lbs.
|
|
Ā
|
|
Tuesday, October 31
|
View Page
|
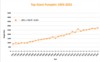 |
top pumpkin trend graph 1993-2023
|
|
Ā
|
|
|